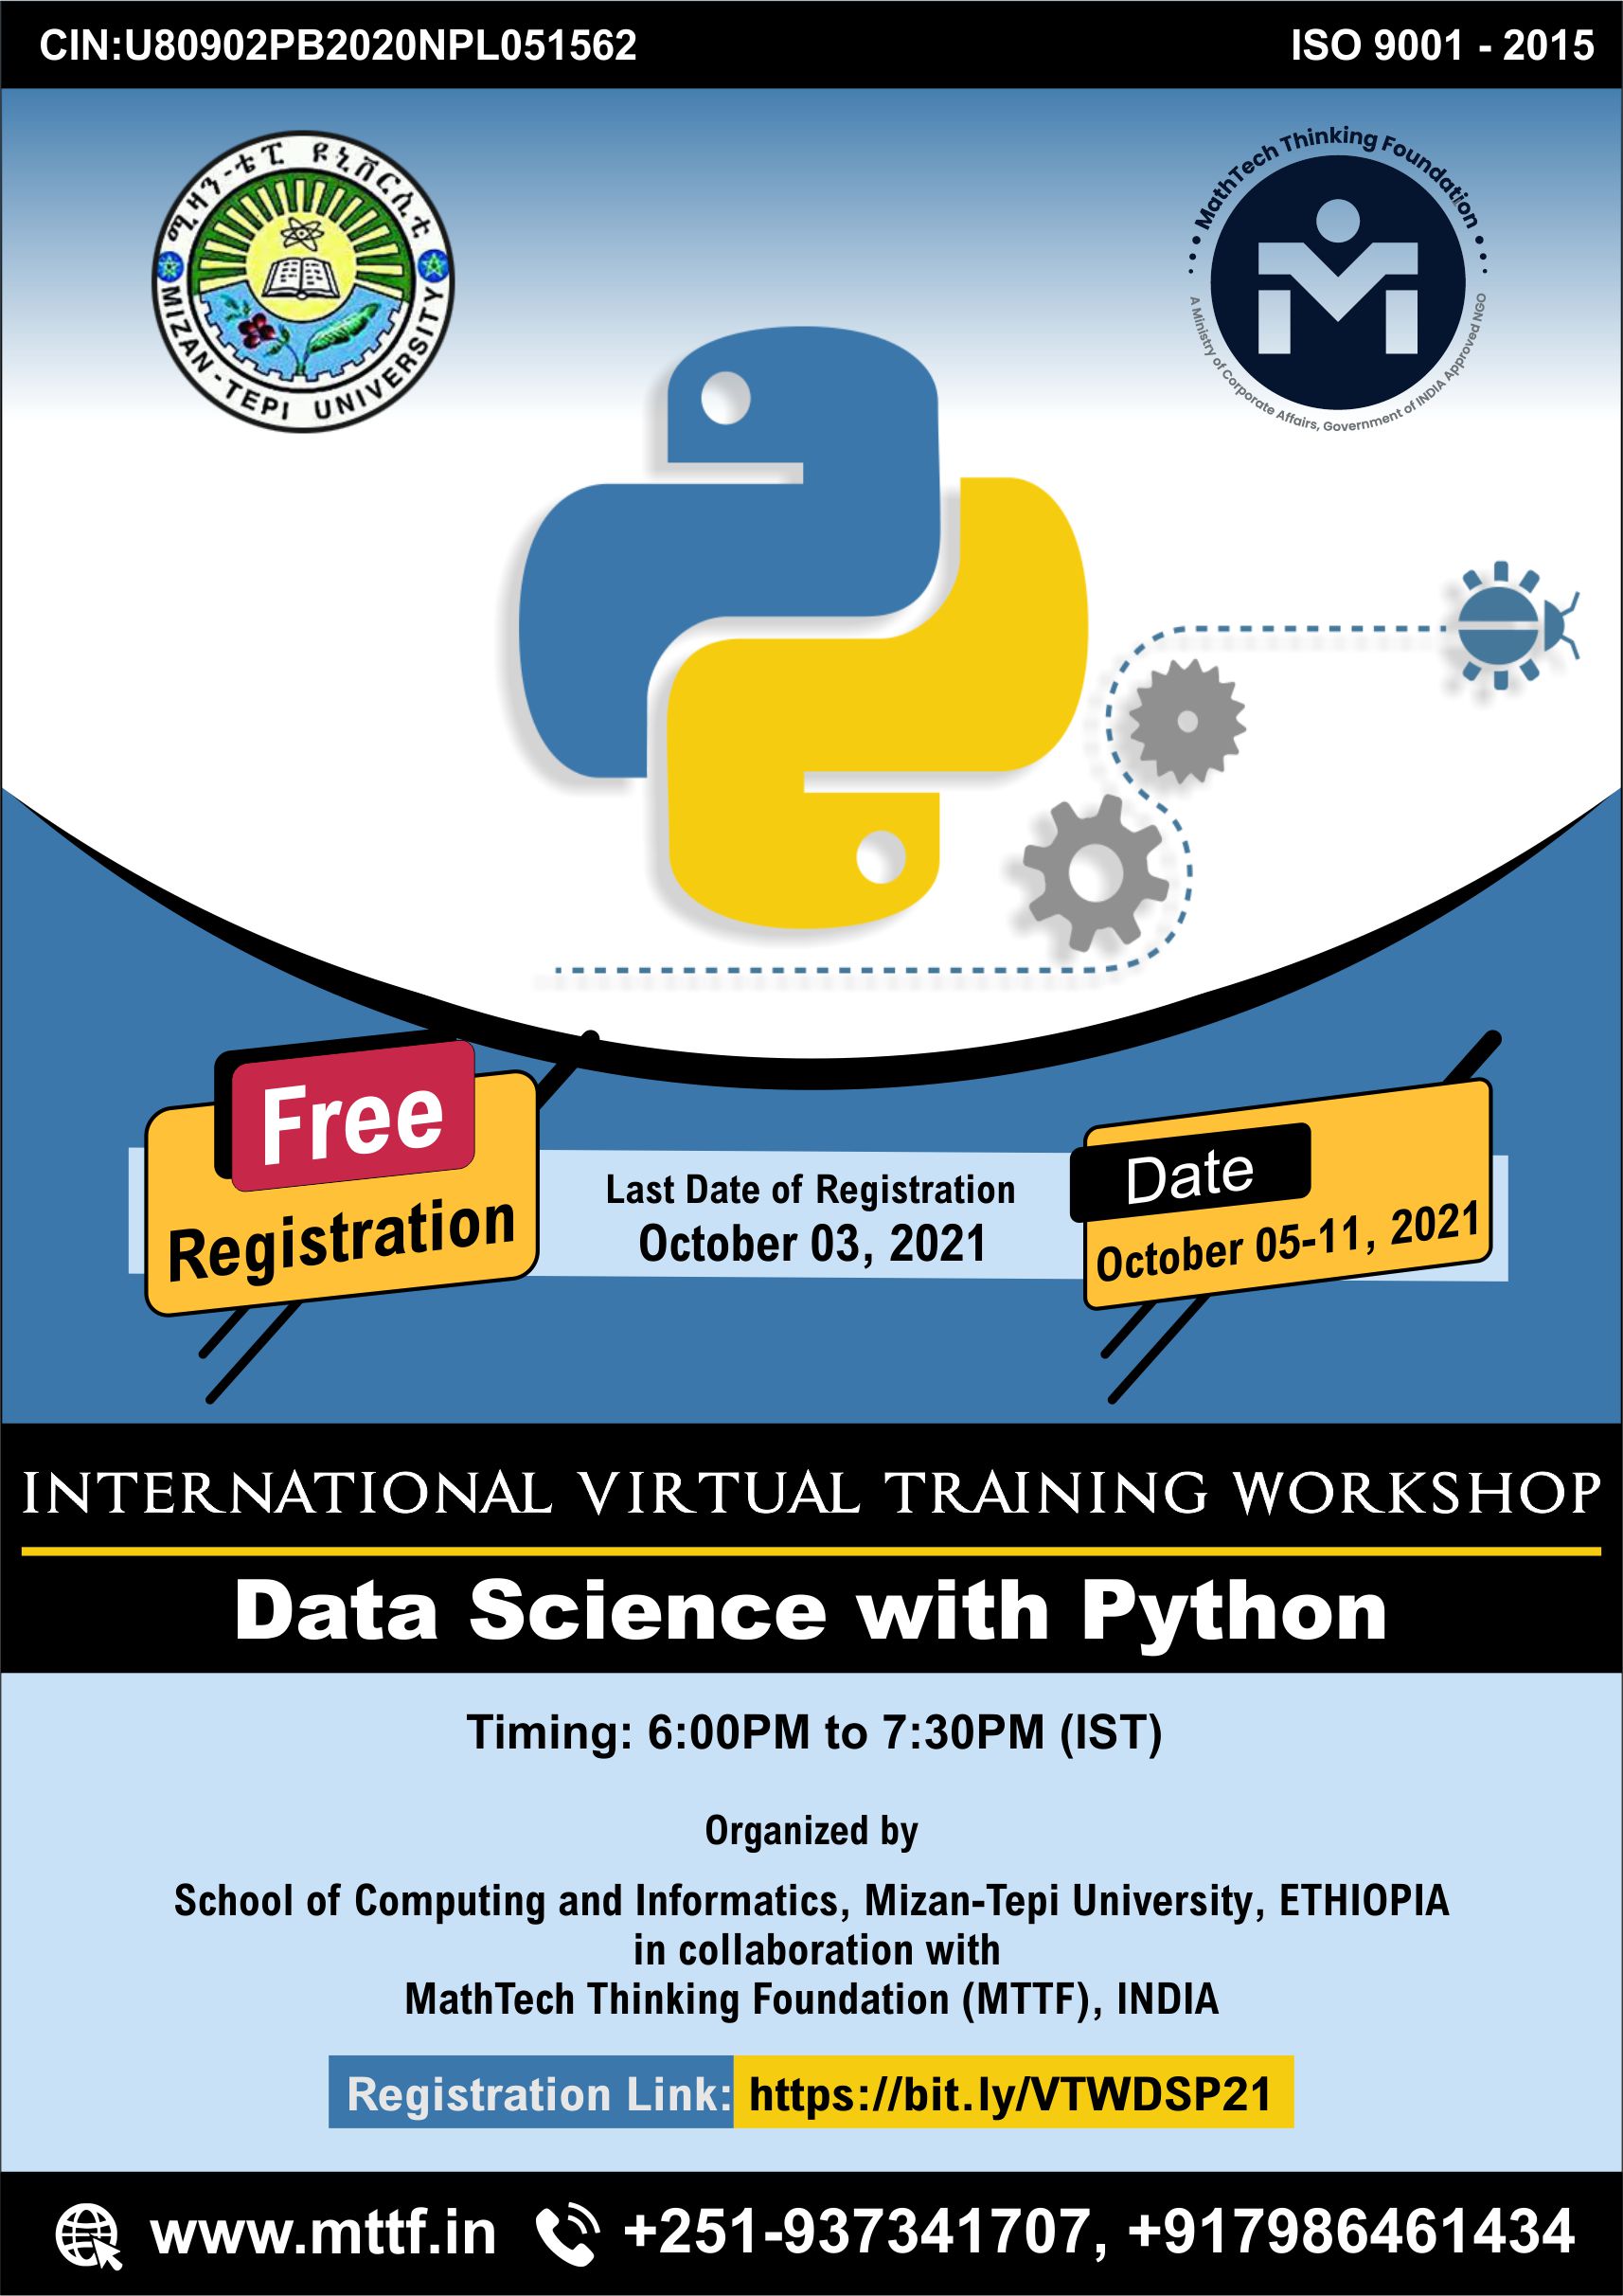
Virtual Training Workshops on Data Science with Python

Event Date:
October 5, 2021
Event Time:
6:00 pm
Event Location:
Objective of the workshop
Data science is a multi-disciplinary area that uses scientific methods, algorithms and systems to extract hidden knowledge and insights from data (Structured and Unstructured). It is the study of where information comes from, what it represents and how it can be transformed into a valuable resource in the creation of business and IT strategies. Mining large amounts of structured and unstructured data to identify patterns can help an organization in many ways. Data Science is confluence of mathematics, statistics and computer science disciplines, and incorporates techniques like machine learning, cluster analysis, data mining and visualization. As Python programming language is framed for Data Science applications it is essential to visualize Data science applications using Python to ripe maximum benefits. Hence, it is important to bring awareness among researchers & academicians and train manpower on data science using Python programming to do innovative research, projects and to create knowledge base.
- To disseminate the knowledge of data sciences among faculty, researchers and academicians.
- To provide conceptual understanding of how data sciences can be used to innovate and improve business processes.
- The create awareness and interest in Python programming among students, and researchers.
- Train manpower in the field of data sciences to fulfill the growing necessity of various organizations.
- To focus on providing the researchers and students insight of overall components of data science.
Targeted Audience
The targeted participants will be Researchers, Public Health, Data analysis, young statisticians, all academicians, agriculture, engineers, and, market survey, economics, and people who are working in industries, trade, and transport. Those who are planning to publish high quality research projects, research articles, textbook, chapters, journals, seminars, conference’s proceedings.
How to register?
MTTF-Member should login their account; click on Upcoming Events; list of events will appear; click on the title or image, then choose register here, at the end submit the information. Non-MTTF-Member can become member, then follow the same process.
Also Non-MTTF-Member can register in Google form click here
About the Workshop
The workshop will be held through Cisco Webex. All the sessions will be hands-on practical and implementation-based. Recording and presented contents will be provided to each registered participant. The timing of each session will be 6:00 PM to 7:30 PM each day. International Participants are requested to fix your local time with IST. Click here for world clock. Limited seats are available. Certificate to each registered participant will be given after attending successfully.
| Dates | Day wise Content |
| 05-10-2021 | Introduction, History, Features, Setting Path, Variable and data, Operators, Conditional Statements, Looping, Control Statements, String manipulation, Lists, Tuple, Working with Tuples, Function and Methods, Dictionaries, working with dictionaries, properties |
| 06-10-2021 | Functions, Defining a function, calling function, types of functions, Modules, Math module, Input-Output functions, reading and writing files Functions, Oops Concept |
| 07-10-2021 | Introduction to Numpy, Numpy Array, Numpy Array Indexing, Numpy Operations, Boolean Indexing, Fancy Indexing Transpose array and Swapping Axes, Universal function: Fast Element-Wise Array Function, Array Oriented Programming with Arrays. Indexing, silencing and Iterating. Array Manipulation – Joining Arrays, Splitting Arrays , Reading and Writing Array Data on Files: Loading and saving Data in Binary Files, Reading Files with Tabular Data. |
| 08-10-2021 | Introduction to pandas Data Structures: The Series, Declaring a Series, Selecting the Internal Elements, Assigning Values to the Elements, Defining a Series from Numpy Arrays and Other Series, Filtering Values, Operations and Mathematical Functions, Evaluating Values, NaN Values. |
| 09-10-2021 | The DataFrame: Defining a Dataframe, Selecting Elements, Assigning Values, Membership of a Value, Deleting a Columns, Filtering, DataFrame from Nested dict, Transposition of a Dataframe, Pandas: Reading and Writing Data, Reading Data in CSV or Text Files |
| 10-10-2021 | Data Visualization with matplotlib: The matplotlib Library, pyplot, The Plotting Window matplotlib and Numpy, Using the kwargs, working with Multiple Figures and Axes, Adding Elements to the Chart, Adding text, Adding a Grid, Adding a Legend, Saving Your Charts, Line Charts, Histograms, Bar Charts, Pie Charts. |
| 11-10-2021 | Advanced Charts – Contour Plots, Polar Charts, The mplot3d Toolkits – 3D Surfaces, Scatter Plots in 3D, Bar Charts in 3D, Multi-Panel Plots: Display subplots within Other Subplots, Grids of Subplots, Algorithms : Linear Regression, Logistic Regression, Naïve Bayes |
Resource Persons
Prof.(Dr.) Pooja: Professor & Associate Dean, Sharda University, UZBEKISTAN
Prof.(Dr.) Ajay Kumar: Department of Computer Science and Engineering, Chitkara University, Rajpura, Punjab, INDIA
Prof.(Dr.) S. Amutha: Department of Computer Science and Engineering, PSR Engineering College, Tamilnadu, INDIA
Prof.(Dr.) Upinder Kaur: Department of Computer Science and Engineering, Akal Univeristy, Bathinda, INDIA
Mr. Dawit Tadesse Gamu: Department of Computer Science, Mizan-Tepi University, ETHIOPIA
Mr. Minyechil Alehegn Tefera: Department of Information Technology, Mizan-Tepi University, ETHIOPIA
Mr. Dhruv Govil, Sr. Data Scientist and Consultant (AI), Galoballogic, Gurgaon, INDIA
Organizing Committee
Chief Patron and Patron
Yideg Mamo: Chief Executive Office Director, Mizan-Tepi University,Tepi Campus, ETHIOPIA
Prof. (Dr.) Mehar Chand: President, MTTF, INDIA & AP, Department of Mathematics, Baba Farid College, Bathinda, Punjab
Semgnew Assemie: Dean, School of Computing and Informatics, Mizan-Tepi University, ETHIOPIA
General Secretary
Mr. Mezgebe Araya: School of Computing and Informatics, R/C/S v/dean, Mizan-Tepi University, ETHIOPIA
Coordinators
Mr. GetahunTadesse: Head, Department of Computer Science, Mizan-Tepi University,Tepi Campus, ETHIOPIA
Mr. Haimanot Bitew: Head, Department of Information Technology, Mizan-Tepi University,Tepi Campus, ETHIOPIA
Ms. Marta Asefa: Head, Department of Information System, Mizan-Tepi University,Tepi Campus, ETHIOPIA
Help Desk
Mr. Wegayehu Enbeyle: Executive officer MTTF, Ethiopia
Whatsapp: +251-937341707
Email Address: contactus@mttf.in
